> ## Documentation Index
> Fetch the complete documentation index at: https://docs.livepeer.org/llms.txt
> Use this file to discover all available pages before exploring further.
# Engagement via Grafana
> Learn how to visualize your engagement metrics with Grafana
In May 2023, we released powerful engagement metrics offering detailed
information on viewer behavior and playback quality on your platform. The API
includes engagement metrics such as view counts and watch time, as well as
performance metrics such as error rate, time to first frame, rebuffer ratio, and
exit-before-starts across a variety of dimensions. For more details, check out
[the docs here][1].
In this tutorial we will introduce a simple, free, and customizable method to
quickly visualize the core metrics and dimensions of the API.
## Prerequisites
Before you begin this tutorial, make sure you have:
1. Integrated the necessary components to capture viewership data. Details
[here][2].
2. Viewed videos via (1) to collect data.
3. Created an [CORS-enabled API Key][3]. The key must allow CORS access from
your Grafana origin, or from all (`*`)
4. Set up a Grafana account and workspace with permissions to add new dashboard
(and datasource/connection, if necessary). A free account is sufficient and
available at [grafana.com][4]
5. Install the [`JSON API`][marcusolsson-json-datasource] plugin for grafana.
With that we are ready to set up our dashboard!
## Setting up the Engagement Dashboard
* Login to Grafana
* Click "Connections" > "Connect Data"
 * Set up your JSON API:
1. Name: e.g. "Livepeer Engagement Data"
2. URL: [`https://livepeer.studio/api/data/views/query`][5]
3. Authentication methods: Forward OAuth Identity
4. TLS Settings: Skip TLS certificate validation
5. Custom HTTP Headers
1. Header: "Authorization"
2. Value: Full Access `Bearer `
* Save and Test
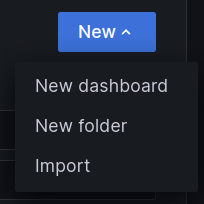
* ["Import" the dashboard][6] from the official [Livepeer Studio Viewership
Engagement dashboard][dashboard] and using the JSON API datasource created
above.
* Set up your JSON API:
1. Name: e.g. "Livepeer Engagement Data"
2. URL: [`https://livepeer.studio/api/data/views/query`][5]
3. Authentication methods: Forward OAuth Identity
4. TLS Settings: Skip TLS certificate validation
5. Custom HTTP Headers
1. Header: "Authorization"
2. Value: Full Access `Bearer `
* Save and Test
* ["Import" the dashboard][6] from the official [Livepeer Studio Viewership
Engagement dashboard][dashboard] and using the JSON API datasource created
above.
 * Rename the dashboard if you'd prefer
[1]: /developers/guides/get-engagement-analytics-via-api
[2]: /developers/guides/get-engagement-analytics-via-api#registering-views
[3]: /api-reference/overview/authentication
[4]: https://grafana.com/ "Grafana"
[5]: /api-reference/viewership/get-viewership-metrics
[6]: https://grafana.com/docs/grafana/latest/dashboards/build-dashboards/import-dashboards/#import-a-dashboard
[dashboard]: https://grafana.com/grafana/dashboards/20511-livepeer-studio-user-engagement/
[marcusolsson-json-datasource]: https://grafana.com/grafana/plugins/marcusolsson-json-datasource/ "JSON API Grafana Plugin"
* Rename the dashboard if you'd prefer
[1]: /developers/guides/get-engagement-analytics-via-api
[2]: /developers/guides/get-engagement-analytics-via-api#registering-views
[3]: /api-reference/overview/authentication
[4]: https://grafana.com/ "Grafana"
[5]: /api-reference/viewership/get-viewership-metrics
[6]: https://grafana.com/docs/grafana/latest/dashboards/build-dashboards/import-dashboards/#import-a-dashboard
[dashboard]: https://grafana.com/grafana/dashboards/20511-livepeer-studio-user-engagement/
[marcusolsson-json-datasource]: https://grafana.com/grafana/plugins/marcusolsson-json-datasource/ "JSON API Grafana Plugin"