What is Timeplus?
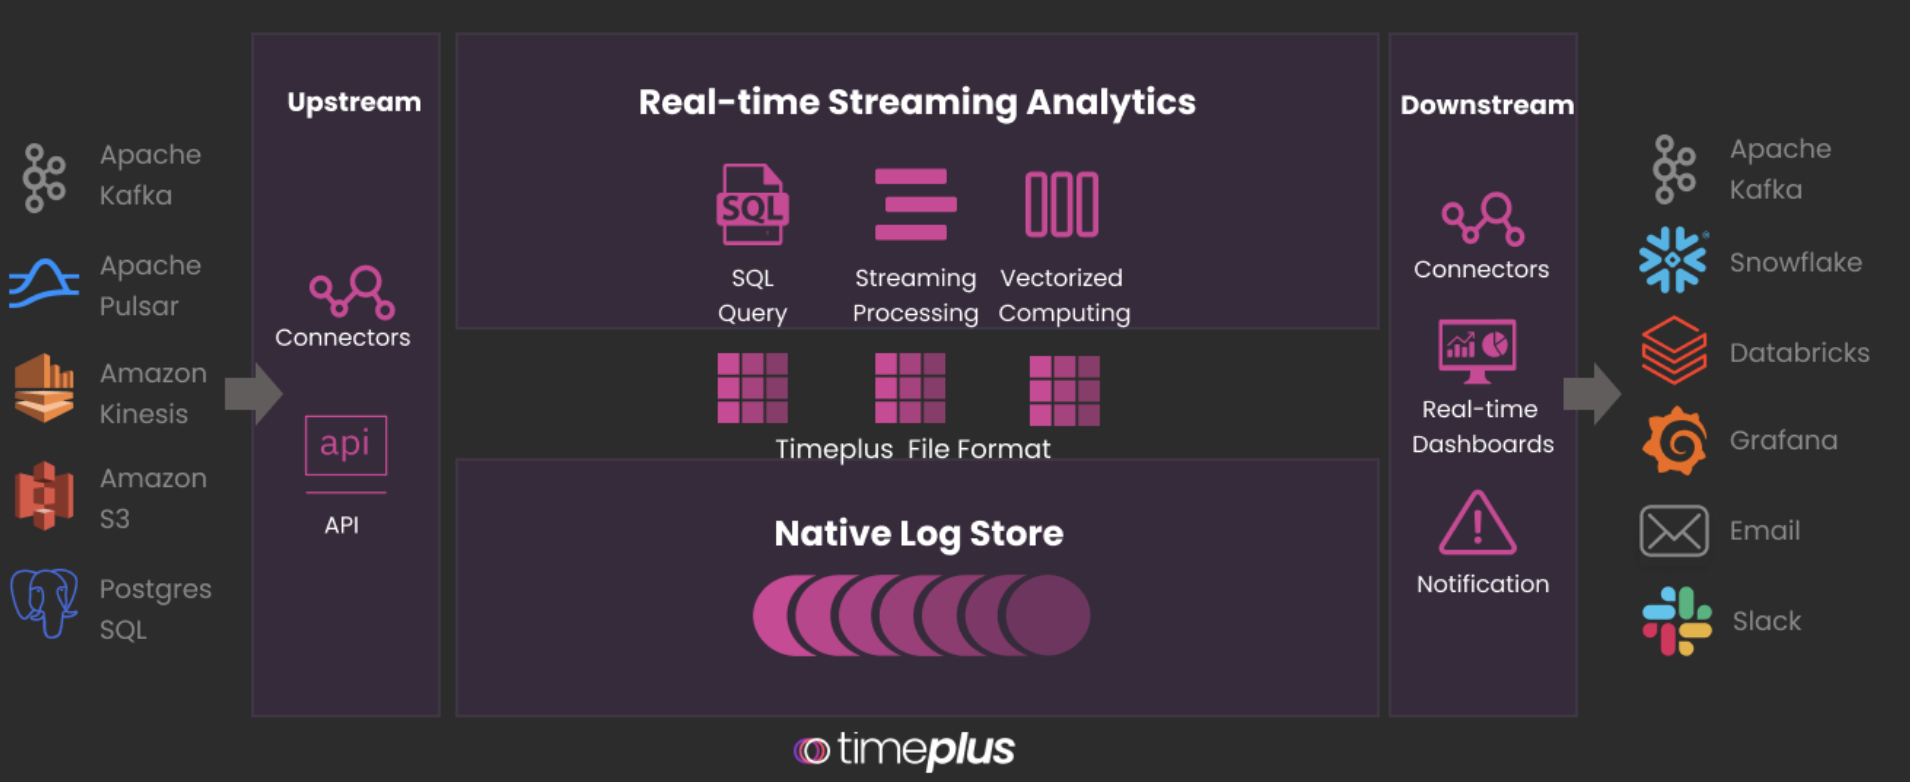
Timeplus is a real-time streaming data analytics platform, it provides analytics functionality combined with both real-time streaming data and historical batching data. You can take it as a combination of streaming processing (such as Apache Flink) + real-time OLAP (such as Apache Druid). Timeplus is a great tool that can be used for engagement metrics analysis due to:- Timeplus offers query analytics capabilities based on SQL, making it user-friendly for those already proficient in SQL.
- Timeplus delivers ultra-low latency real-time queries, instantly delivering analytical results to users as events occur.
- Timeplus facilitates the extraction of query time information, eliminating the need for traditional ETL processes. Users can swiftly create analytics by combining diverse data sources.

How to get started using Timeplus with Livepeer’s Engagement Data
Analyzing Livepeer engagement metrics on Timeplus is incredibly easy. Based on the Timeplus terraform provider, users can create the whole analytic solution with a few simple commands. Here is the process, assuming you have both a Livepeer studio account and a Timeplus workspace created.- Create a Livepeer API Key
- Create your Timeplus API Key
- Install terraform https://developer.hashicorp.com/terraform/tutorials/aws-get-started/install-cli
- Download the Livepeer terraform resource definition from https://github.com/timeplus-io/livepeer-source/blob/main/stacks/main.tf to your local directory
- Open a terminal from the directory and add following environments
- Deploy the resources to Timeplus Cloud by run the following commands
- A stream of engagement
metrics with name
livepeer_viewership_metrics_kv - A Livepeer source which will periodically pull data from Livepeer API and store the metrics data into the defined stream
- A user defined function (UDF) that turns the geohash into geo locations with longitude and latitude.
- A dashboard that contains the
following:
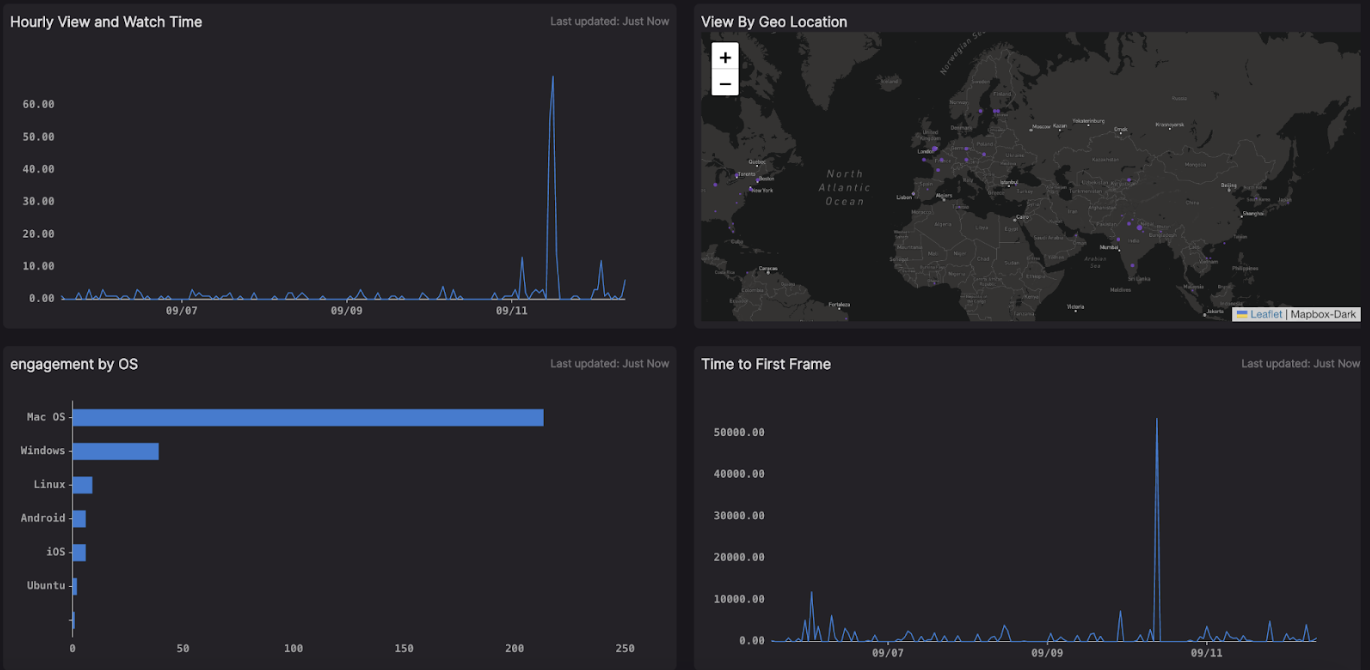
- Hourly Views and Watch Time
- Engagement by OS
- View count by Video (Top 5)
- View count by Device Type (Top 5)
- Rebuffering Percentage
- Time to First Frame
- View By Geo Locations
